
Economic Metrics as a Percentage of GDP
- Jul 4, 2025
- 4 min read

GDP (Gross Domestic Product) is an economic indicator that measures the total value, in local currency, of all goods produced and services sold for a given period. As an economy grows, whether by greater population or increased productivity, so does the GDP.
As the GDP for the U.S. is measured in dollars, we must adjust the measurement for inflation, which is what the Real GDP measurement is.
Here is the Real GDP since 1960:
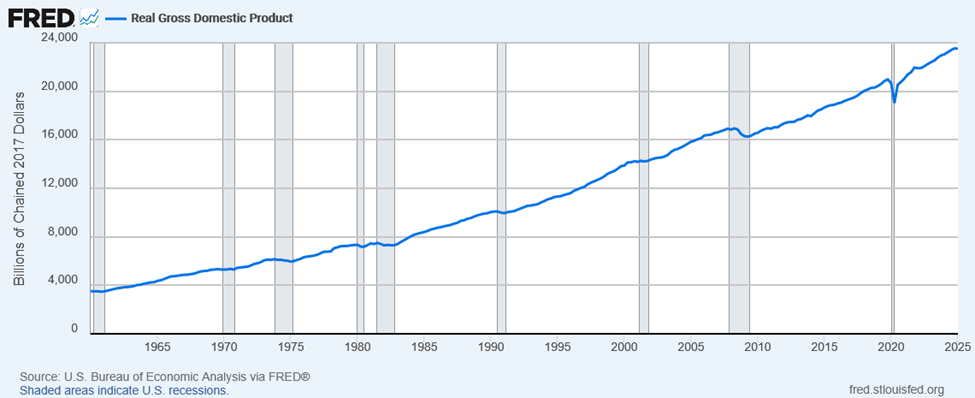
The gradual growth reflects the continuous improvement in our standard of living, with some hiccups (the grey columns representing recessions) along the way.
The GDP is the best approximation we have for estimating the amount of economic wealth created over a given time period. Not perfect, but good enough.
While the private sector is busy creating wealth, the federal government’s primary function is to redistribute that created wealth, in the form of tax revenue and expenditures. Let’s see what happens when we divide the “amount of wealth being transferred” by “the amount of wealth being created,” and convert it to a percentage.
Important to note that as both the upper and lower parts of this fraction are in units of dollars, we are left with a unit-less ratio that reflect wealth, and not dollars, which is exactly how we should analyze economics.
This also conveniently cancels out the distortion caused by inflation.
This next graph displays the Federal Receipts (i.e. net tax revenue) as a percentage of the GDP.

As expected, less tax revenue is collected during recessions.
This graph is a little squiggly, so here is the same data average over every three data points:

Which shows that federal tax receipts, as a percentage of wealth created, have remained mostly constant for the last 65 years, averaging about 17%.
Perhaps suggesting that this is an optimal level.
This next graph serves to remind us of what interest rates have been doing for this same period.

Three things to note:
- The high interest rates from about 1978 – 1987
- The gradual decrease of rates from 1987 to 2020
- The recent increase in rates, starting in 2020
Next, we have an informative graph that displays federal government expenditures, (broken down into the major categories), as a percentage of GPD. (Found this graph and the next one here on Reddit, my thanks to the creator.)

An initial observation is that there has been a gradual increase in net expenditures from about 17% to 23%, representing a growing government that is gradually redistributing more and more wealth. Which raises the question of what the optimal expenditure level is? Has it been exceeded.
Let’s highlight where this gradual increase has occurred.
Here is the same data, broken down into the six individual categories:

From these graphs we can infer that the wealth redistributed to:
- Defense experienced a significant decline from 8% to 3%.
- Income Security (i.e. Social Security) gradually increased from 4% to 8%.
- Health experienced a dramatic increase from 0% to 7%.
- Other remained constant at 2% (aside from the Covid era).
- Interest payments on the debt experienced a modest increase from 2% to 3%, with a bump in the middle corresponding to the high interest rates during those years, and since 2020, an uptick.
While tax receipts as a percentage of GDP have remained constant, the significant “budget busting” culprits are Income Security and Health, a reflection of an aging population, longer lives, and the availability of more (and expensive) procedures and medication.
Compounding this problem is the recent uptick in the interest payments on the debt, reflecting higher debt levels and higher interest rates. If interest rates remain at this level (or increase), and / or the deficit continues to increase, this category may increase, resulting in less wealth being available for redistribution to the other categories.
Another conclusion to be made is that there is not much to gain by reducing the amount of wealth being transferred to Defense, as it is already relatively small.
While some propose an increase in taxes to reduce the deficit, what needs to be asked is so wrong with the historical 17% of GDP? What has changed? And why would a higher tax rate not reduce GDP growth, thus cancelling out the benefit of the higher tax rate?
Some propose that we can grow our way out of the deficit, that a higher GDP will generate more tax revenue. True, but exactly what changes will be made to increase the GDP from where we are today? And how to avoid the periodic recessions that reduce GDP growth?
Or perhaps more focus needs to be placed on reducing the cost of Social Security and the various programs.
What I do know is that doing nothing different will produce the same outcome, a greater deficit, and less wealth for the other five categories. You may assume that I am disappointed by the “Big Beautiful Bill”, as it did not address this festering bi-party spending problem.


Comments